Time for correlations
A few posts ago I was talking about heritabilities (like here) and it’s time to say something about genetic correlations. This is how I explain correlations to myself or in meetings with colleagues. Nothing formal, mostly an analogy.
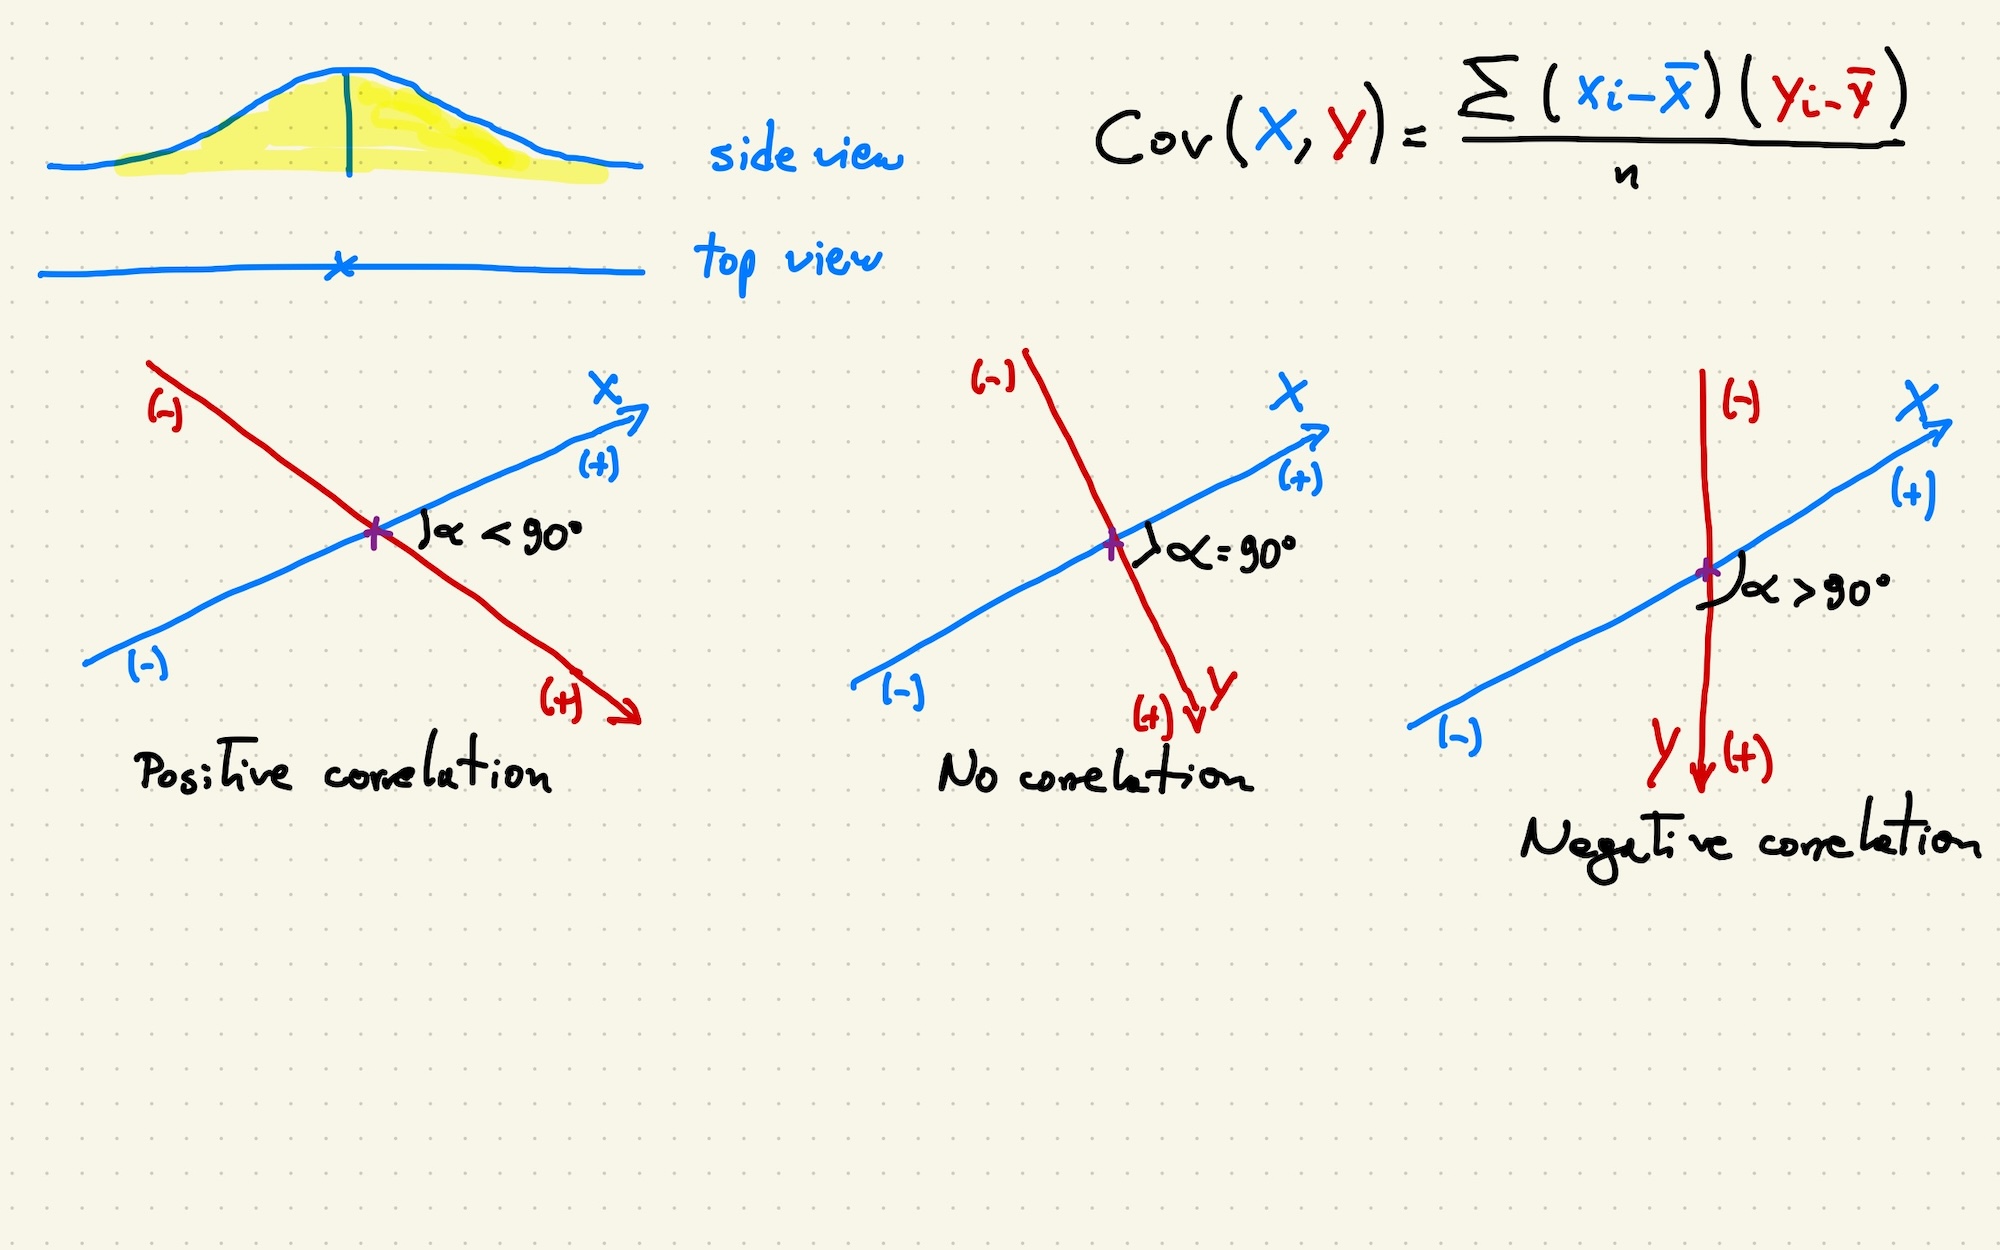
Say we have to draw a distribution of breeding values for one trait (X) and, rather than looking from the side, we look at it from the top. It looks like a straight line, where the length gives an idea of variability and the cross marks the mean. We can have another distribution (Y), perhaps not as long (so not so variable) or maybe longer.
Often variables will vary together (co-vary, vary at the same time) and we can show that by drawing the lines at an angle, where they cross at their means. If you look at the formula for the covariance (co-variance, because traits co-vary, get it?), we grab the deviation from the mean for the two traits for each of the observations, multiply them, add them all up and get their average. We get positive values for the product when both traits are above or below the mean; we get negative values when one trait is below the mean and the other above it. Covariances are a pain, as they can take any value. Instead we can use “standardised” covariances, that vary between -1 and 1: we call these things *correlations*.
If the angle between the distributions is less than 90 degrees, increasing the values of one of the traits is (on average) accompanied by an increase on the other trait. then we have a positive covariance and, therefore, a positive correlation. The smaller the angle, the closer to a correlation of 1.
If the angle is 0 degrees (or close to it), changing the value of one trait has no (or very little) effect on the other trait. Zero correlation.
If the angle is greater than 90 degrees, changing the value of one trait tends to reduce the values of the other trait. The closer the angle to 180 degrees (so the positive values of one distribution are closer to the negative values of the other distribution), the closer to a -1 correlation.
Why do we care about these correlations? We use them all over the place in breeding. Sometimes as a measure of trade-off, as in “if I increase X, what will happen with Y?” or correlated response to selection. We also use them to understand how much information in one trait is contained in another trait, as in “can I use X as a selection criteria for Y?”. And a bunch of other uses, as well. But that’s another post.